http://www.doctorhousingbubble.com/japan-iwato-and-heisei-boom-real-estate-bubble-stock-market-bubble/
SS says
This is an excellent article and I completely agree with him.
Pls read.
===========
Asset bubbles and economies built on inflated prices are nothing new. We have many lessons during the Great Depression that reflect boom and bust cycles. As policy makers try to look at historical references for guidance many are now turning their analysis to the Japanese bubble economy. Japan serves as a good reference since there are many parallels between their bubble economy and the one we are currently facing. Yet Japan never fully emerged from their bust. The decisions taken by the Federal Reserve and our government reflect many of the policy decisions taken by Japan after their Iwato and Heisei booms and busts. The first bubble was reflected in the stock market followed by a giant real estate bubble. You can parallel the NASDAQ boom of the 1990s and the real estate bubble of the 2000s.
Some will point to smaller countries that suffered rampant inflation after their central banks printed money but we have more in common with Japan, what was the 2nd largest economy in the world. In this article we will try to carefully look at research on the Japanese boom and bust and also take a look where we stand in our current financial crisis.
Source: The Economist
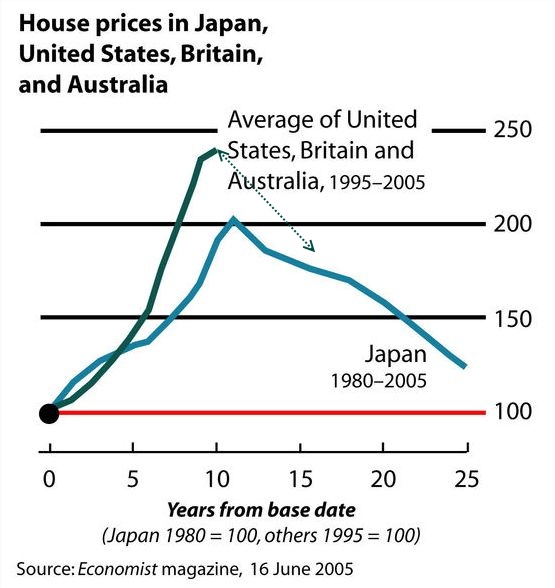
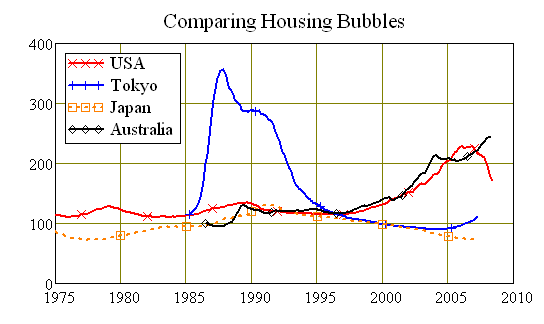
The first definite comparison we can make is with the rampant rise in home values. Japanese real estate values saw a massive ten year boom during the Heisei boom. The chart above clearly shows the trajectory of land values. Yet research shows that a large part of this was concentrated on a few urban cities. In this regard, the U.S. had a much larger and more pervasive boom impacting multiple cities across the nation like Miami, Las Vegas, New York, Los Angeles, San Francisco, Phoenix, and many other locations. If we separate Tokyo out we see that overall Japan did have a bubble but it doesn’t seem as large or as widespread:
Source: Debt Deflation
The above is an interesting chart because it reflects a concentrated urban bubble. We had many suburbs popping up with home builders trying to create demand where there was nothing more than a bubble to chase. Many of these areas including the Inland Empire in California have large homes selling for half off (or more) with very little demand chasing after the homes. It is an interesting case study as to why values go up so quickly but miscalculations by the Federal Reserve and misguided policies led to the biggest and most widespread housing bubble here in the United States.
A 2003 paper by the Bank for International Settlements (BIS) focused on the Japanese housing bubble and concluded the following:
“What should be noted regarding Japan’s experience is that the enthusiasm of market participants, together with the inconsistent projection of fundamentals, contributed to a large degree to maintaining temporarily high asset prices at that time. Such enthusiasm is often called euphoria, excessively optimistic but unfounded expectations for the long-term economic performance, lasting for several years before dissipating.”
“It was thus excessive optimism rather than consistent projection of fundamentals that mainly supported temporarily high asset prices.”
There is little to debate that what fueled housing prices in the U.S. was also ignited by euphoria for real estate that was largely disconnected from fundamentals. Let us construct a chart similar to the above with Tokyo and Japan but in this case, we will look at the Los Angeles MSA and the 10 city composite from the Case Shiller data:
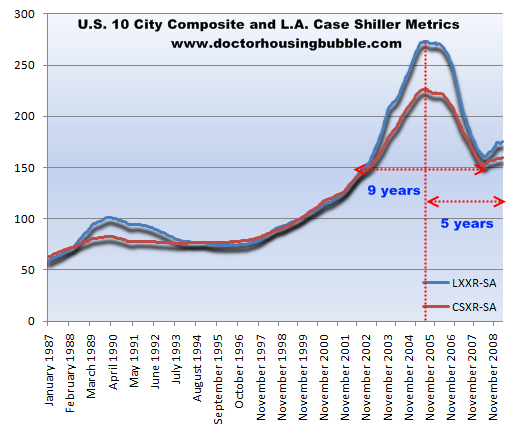
Although it would appear that Tokyo had a much quicker and faster rise in prices, an area like Los Angeles saw a very similar trend. Yet what separates the two bubbles is that the U.S. as an entire nation also saw a massive rise in prices over a short period of time. Looking back, we see that the peak for U.S. housing values was reached in 2006 with the Los Angeles MSA also reaching a peak in this year. The chart above shows the clear decade long boom in housing values. What we find over this decade period is that home values in the U.S. increased by a factor of 3 while home values in L.A. increased by a stunning factor of 4. In other words, the U.S. housing bubble was equally as large in magnitude as that faced by Japan but much more widespread.
The BIS paper also makes the comparison that Japan faced nearly two decades of bubbles, one started in the stock market followed by the real estate bubble:
“First, at the time of the Iwato boom, when Japan’s economy entered the so-called “high economic growth period”, asset prices increased rapidly, reflecting an improvement in fundamentals due to technological innovations. The real economic growth rate exceeded 10% per annum, driven mainly by investment demand due to technological innovations that replaced the post World War II reconstruction demand. On the price front, consumer prices rose while wholesale prices remained generally stable, thus leading to the so-called “productivity difference inflation”.
“Kakuei Tanaka, who became Prime Minister in 1972, effected extremely aggressive public investment based on his belief (remodelling the Japanese archipelago) that it was necessary to resolve overpopulation and depopulation problems by constructing a nationwide shinkansen railway network, which led to an overheated economy.”
This economy is largely seen by the charts below:
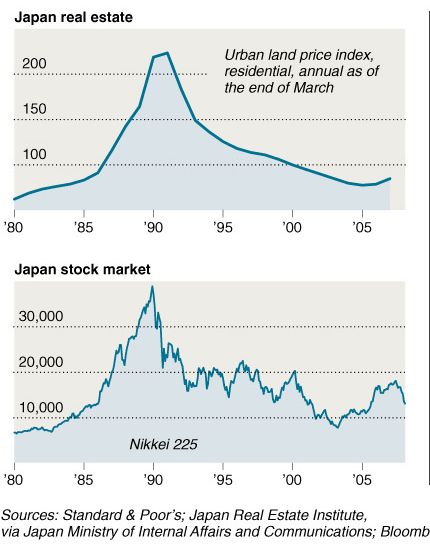
We have a very similar parallel here with our NASDAQ boom of the 1990s followed by the real estate boom reflected on the previous chart looking at Case Shiller home values. If we look at the NASDAQ, we realize that even after the recent boom in stock values prices are nowhere near their peak:

On a nominal level the NASDAQ is still off by 55 percent from the peak reached a decade ago. Often we hear about the lost decade comparison. In stock values, we are already there. In terms of real estate values, we are quickly approaching that point. So we have more similarities in our booms and busts with Japan than many would like to admit. The 1990s saw a rise also in productivity brought on by technological innovation but this also paved the wave for an economy largely decentralized on a global level. This hit hard in the manufacturing core of our country. Someone made the argument to me at the height of the real estate boom that “you can’t outsource real estate” which is true but that is a double edged sword as we are seeing. The Nikkei peaked on December 29, 1989 closing at 38,915.87. Today it stands at 9,431, a drop of over 75 percent. Massive bubbles can have long lasting impacts on the economy.
Missing asset bubbles and targeting inflation
Another important comparison made in the paper is that of perceived stable inflation and how central banks can miss asset bubbles while they are happening. It is the mistaking of a bubble for real economic growth:
“Third, in the Heisei boom, asset prices increased dramatically under long-lasting economic growth and stable inflation. Okina et al (2001) define the “bubble period” as the period from 1987 to 1990, from the viewpoint of the coexistence of three factors indicative of a bubble economy, that is, a marked increase in asset prices, an expansion in monetary aggregates and credit, and an overheating economy. The phenomena particular to this period were stable CPI inflation in parallel with the expansion of asset prices and a long adjustment period after the peaking of asset prices.”
“The decline in asset prices was initially regarded as the bursting of the asset price bubble, and an amplifying factor of the business cycle. Although the importance of cyclical aspects cannot be denied, further declines in asset prices after the mid-1990s seem to reflect the downward shift in the trend growth rate beyond the boom-bust cycle of the asset price bubble.”
This is an important key point. The Federal Reserve publicly stated that during the bubble (it wasn’t labeled as such) that inflation overall remained tame and therefore keeping interest rates low was viewed as a prudent policy. If the economy is growing and is stable, then the central bank should keep liquidity flowing into the system to keep building up legitimate businesses. Yet separating real growth with an asset bubble can be tricky especially when the policies taken are part of the reason for the asset inflation. Japan viewed there measures as stable. We did this in a similar fashion but part of it was that our metrics to measure inflation largely missed the housing bubble. The CPI measures “owners equivalent of rent” which completely ignored the rise in home values. This measure is the biggest in the CPI so the data was skewed. Also, innovation in mortgage products with teaser payments altered the true monthly payment and understated it. The government for most of this time also only focused on OFHEO (now FHFA) which only looked at home loans secured by Fannie Mae and Freddie Mac and ignored the vast majority of subprime Alt-A, and option ARMs that fueled the last stage of the housing bubble. In fact, year over year changes in the inflation measure from 1980 to 2000 seemed to be as stable as they come:
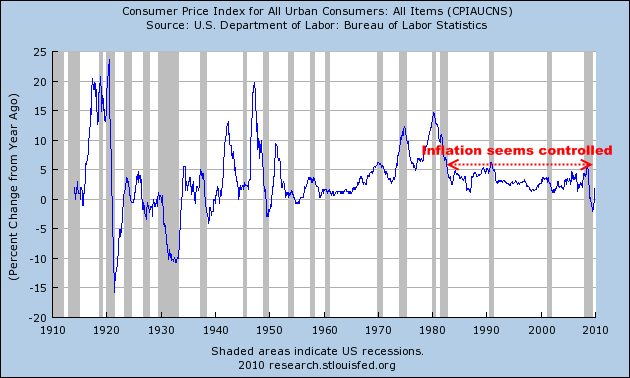
During this time we saw the massive NASDAQ bubble and also, the subsequent real estate bubble. Inflation data largely ignored most of it because the measure was flawed when it came to measuring bubbles. Japan had similar problems and taking policy decisions on this data has given their economy two lost decades and their economy is still suffering. Then why follow that same path?
Japan gives us a working sample as to what can happen with asset deflation, a stock bubble popping, allowing banks to remain propped up by government funding, and massive government spending:
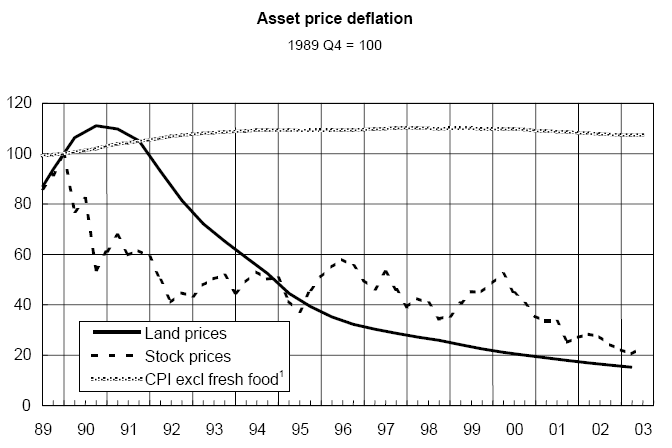
*Japan asset, stock and CPI measures
Some seem to think that Japan just sat back and did nothing during this time. There is nothing further from the truth. Japan was the first major economy to go down the path of quantitative easing. Japan also injected enormous amounts of money into their economy to stimulate growth. Yet the above chart is rather clear in the outcome. Some point to unemployment in Japan remaining low. This is more a sleight of hand with economic data. Although the official rate is low, nearly 1 out of 3 Japanese workers are considered part-time employed. That is, no security of long-term employment. We have seen a massive rise in the number of Americans that now work in a part-time fashion. No benefits, lower wages, and job security that is no longer an option in the longer term. It is easy to see why asset prices in Japan have remained depressed for so long. Prices in the U.S. are showing no sign of inflationary pressures because there is little mechanism to force wages up with such a giant over supply of labor in the market. This is possibly one of the major points missed by those who predict inflation or hyper-inflation in the future. Central banks can print but they can’t force wages up especially in a global market where cheap wages are the status quo. To the contrary, banks are following the zombie like behavior of Japan banks by hoarding funds:
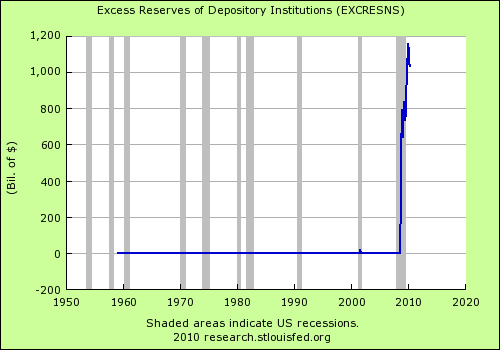
Now that we’ve had three full years after the bubble popped, we can see what banks have done to “fix” the problem:
-Hoard money to fix balance sheet imbalances
-Suspend mark to market (Japan banks zombie like tool of preference)
-Ignore major commercial real estate problems
-Drag out the real estate problems (we have done the same with banks delaying the foreclosure process, stopped lending their own capital in place of government loans, and banks have turned inward with government bailout funds).
The above chart shows that banks are still sitting on an enormous amount of excess reserves. Now that due diligence is back (to a certain degree) who are banks going to lend to? 4 out of 10 workers in the U.S. are employed by the low paying service sector. Close to 15 million are officially unemployed and unless we go back to the easy lending mortgage days, they won’t be getting any bank money soon. We have another 9 million workers that are employed part-time for economic reasons (similar to the large employment base of Japan). You think this group is going to get a loan for a home anytime soon? Banks have turned their profits inward while the real economy is largely in stagnation. Yet if Japan is any indicator, these profits will start to go down:
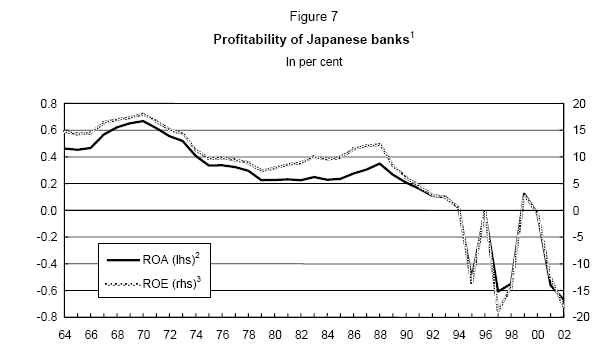
While it is easy to make money right now since a large part of the competition has failed while a select few have been given government backing and funding, as time goes on this profitability goes away. And the real economy in Japan has languished all this time. The BIS paper in 2003 gives a wonderful synopsis of what led to the Japanese boom and bust economy:
“The intensified bullish expectations were certainly grounded in several interconnected factors. The factors below are often pointed out as being behind the emergence and expansion of the bubble:
• aggressive behaviour of financial institutions
• progress of financial deregulation
• inadequate risk management on the part of financial institutions
• introduction of the Capital Accord
• protracted monetary easing
• taxation and regulations biased towards accelerating the rise in land prices
• overconfidence and euphoria
• overconcentration of economic functions in Tokyo, and Tokyo becoming an international financial centre
Focusing on monetary factors, it is important to note the widespread market expectations that the then low interest rates would continue for an extended period, in spite of clear signs of economic expansion. The movement of implied forward rates from 1987 to 1989 (Figure 5) shows that the yield curve flattened while the official discount rate was maintained at a low level.”
You might as well put this label on the U.S. Aggressive behavior of financial institutions? Doesn’t get more aggressive than giving a loan to someone with no job and no income. Progress of financial deregulation? What about repealing Glass-Steagall in 1999, protection we had put in place back from the Great Depression. Inadequate risk management? We need only look at AIG, Lehman Brothers, Bear Stearns, Fannie Mae and Freddie Mac, and many others. Protracted monetary easing? Does a zero percent interest rate and buying up of mortgage backed securities count? Taxation and regulations biased toward rising prices? How about giving new home buyers a tax credit when they were going to buy anyway? Over confidence and euphoria? Just go to YouTube and watch some of the real estate commercials from the peak days of the housing bubble.
We have a lot that is similar to Japan and their boom and bust economy. If their path is any indication of our own, we have a long road ahead and getting home prices back up is probably going to be the least of our concerns.
SS says
This is an excellent article and I completely agree with him.
Pls read.
===========
Asset bubbles and economies built on inflated prices are nothing new. We have many lessons during the Great Depression that reflect boom and bust cycles. As policy makers try to look at historical references for guidance many are now turning their analysis to the Japanese bubble economy. Japan serves as a good reference since there are many parallels between their bubble economy and the one we are currently facing. Yet Japan never fully emerged from their bust. The decisions taken by the Federal Reserve and our government reflect many of the policy decisions taken by Japan after their Iwato and Heisei booms and busts. The first bubble was reflected in the stock market followed by a giant real estate bubble. You can parallel the NASDAQ boom of the 1990s and the real estate bubble of the 2000s.
Some will point to smaller countries that suffered rampant inflation after their central banks printed money but we have more in common with Japan, what was the 2nd largest economy in the world. In this article we will try to carefully look at research on the Japanese boom and bust and also take a look where we stand in our current financial crisis.

Source: The Economist
The first definite comparison we can make is with the rampant rise in home values. Japanese real estate values saw a massive ten year boom during the Heisei boom. The chart above clearly shows the trajectory of land values. Yet research shows that a large part of this was concentrated on a few urban cities. In this regard, the U.S. had a much larger and more pervasive boom impacting multiple cities across the nation like Miami, Las Vegas, New York, Los Angeles, San Francisco, Phoenix, and many other locations. If we separate Tokyo out we see that overall Japan did have a bubble but it doesn’t seem as large or as widespread:

Source: Debt Deflation
The above is an interesting chart because it reflects a concentrated urban bubble. We had many suburbs popping up with home builders trying to create demand where there was nothing more than a bubble to chase. Many of these areas including the Inland Empire in California have large homes selling for half off (or more) with very little demand chasing after the homes. It is an interesting case study as to why values go up so quickly but miscalculations by the Federal Reserve and misguided policies led to the biggest and most widespread housing bubble here in the United States.
A 2003 paper by the Bank for International Settlements (BIS) focused on the Japanese housing bubble and concluded the following:
“What should be noted regarding Japan’s experience is that the enthusiasm of market participants, together with the inconsistent projection of fundamentals, contributed to a large degree to maintaining temporarily high asset prices at that time. Such enthusiasm is often called euphoria, excessively optimistic but unfounded expectations for the long-term economic performance, lasting for several years before dissipating.”
“It was thus excessive optimism rather than consistent projection of fundamentals that mainly supported temporarily high asset prices.”
There is little to debate that what fueled housing prices in the U.S. was also ignited by euphoria for real estate that was largely disconnected from fundamentals. Let us construct a chart similar to the above with Tokyo and Japan but in this case, we will look at the Los Angeles MSA and the 10 city composite from the Case Shiller data:

Although it would appear that Tokyo had a much quicker and faster rise in prices, an area like Los Angeles saw a very similar trend. Yet what separates the two bubbles is that the U.S. as an entire nation also saw a massive rise in prices over a short period of time. Looking back, we see that the peak for U.S. housing values was reached in 2006 with the Los Angeles MSA also reaching a peak in this year. The chart above shows the clear decade long boom in housing values. What we find over this decade period is that home values in the U.S. increased by a factor of 3 while home values in L.A. increased by a stunning factor of 4. In other words, the U.S. housing bubble was equally as large in magnitude as that faced by Japan but much more widespread.
The BIS paper also makes the comparison that Japan faced nearly two decades of bubbles, one started in the stock market followed by the real estate bubble:
“First, at the time of the Iwato boom, when Japan’s economy entered the so-called “high economic growth period”, asset prices increased rapidly, reflecting an improvement in fundamentals due to technological innovations. The real economic growth rate exceeded 10% per annum, driven mainly by investment demand due to technological innovations that replaced the post World War II reconstruction demand. On the price front, consumer prices rose while wholesale prices remained generally stable, thus leading to the so-called “productivity difference inflation”.
“Kakuei Tanaka, who became Prime Minister in 1972, effected extremely aggressive public investment based on his belief (remodelling the Japanese archipelago) that it was necessary to resolve overpopulation and depopulation problems by constructing a nationwide shinkansen railway network, which led to an overheated economy.”
This economy is largely seen by the charts below:

We have a very similar parallel here with our NASDAQ boom of the 1990s followed by the real estate boom reflected on the previous chart looking at Case Shiller home values. If we look at the NASDAQ, we realize that even after the recent boom in stock values prices are nowhere near their peak:

On a nominal level the NASDAQ is still off by 55 percent from the peak reached a decade ago. Often we hear about the lost decade comparison. In stock values, we are already there. In terms of real estate values, we are quickly approaching that point. So we have more similarities in our booms and busts with Japan than many would like to admit. The 1990s saw a rise also in productivity brought on by technological innovation but this also paved the wave for an economy largely decentralized on a global level. This hit hard in the manufacturing core of our country. Someone made the argument to me at the height of the real estate boom that “you can’t outsource real estate” which is true but that is a double edged sword as we are seeing. The Nikkei peaked on December 29, 1989 closing at 38,915.87. Today it stands at 9,431, a drop of over 75 percent. Massive bubbles can have long lasting impacts on the economy.
Missing asset bubbles and targeting inflation
Another important comparison made in the paper is that of perceived stable inflation and how central banks can miss asset bubbles while they are happening. It is the mistaking of a bubble for real economic growth:
“Third, in the Heisei boom, asset prices increased dramatically under long-lasting economic growth and stable inflation. Okina et al (2001) define the “bubble period” as the period from 1987 to 1990, from the viewpoint of the coexistence of three factors indicative of a bubble economy, that is, a marked increase in asset prices, an expansion in monetary aggregates and credit, and an overheating economy. The phenomena particular to this period were stable CPI inflation in parallel with the expansion of asset prices and a long adjustment period after the peaking of asset prices.”
“The decline in asset prices was initially regarded as the bursting of the asset price bubble, and an amplifying factor of the business cycle. Although the importance of cyclical aspects cannot be denied, further declines in asset prices after the mid-1990s seem to reflect the downward shift in the trend growth rate beyond the boom-bust cycle of the asset price bubble.”
This is an important key point. The Federal Reserve publicly stated that during the bubble (it wasn’t labeled as such) that inflation overall remained tame and therefore keeping interest rates low was viewed as a prudent policy. If the economy is growing and is stable, then the central bank should keep liquidity flowing into the system to keep building up legitimate businesses. Yet separating real growth with an asset bubble can be tricky especially when the policies taken are part of the reason for the asset inflation. Japan viewed there measures as stable. We did this in a similar fashion but part of it was that our metrics to measure inflation largely missed the housing bubble. The CPI measures “owners equivalent of rent” which completely ignored the rise in home values. This measure is the biggest in the CPI so the data was skewed. Also, innovation in mortgage products with teaser payments altered the true monthly payment and understated it. The government for most of this time also only focused on OFHEO (now FHFA) which only looked at home loans secured by Fannie Mae and Freddie Mac and ignored the vast majority of subprime Alt-A, and option ARMs that fueled the last stage of the housing bubble. In fact, year over year changes in the inflation measure from 1980 to 2000 seemed to be as stable as they come:

During this time we saw the massive NASDAQ bubble and also, the subsequent real estate bubble. Inflation data largely ignored most of it because the measure was flawed when it came to measuring bubbles. Japan had similar problems and taking policy decisions on this data has given their economy two lost decades and their economy is still suffering. Then why follow that same path?
Japan gives us a working sample as to what can happen with asset deflation, a stock bubble popping, allowing banks to remain propped up by government funding, and massive government spending:

*Japan asset, stock and CPI measures
Some seem to think that Japan just sat back and did nothing during this time. There is nothing further from the truth. Japan was the first major economy to go down the path of quantitative easing. Japan also injected enormous amounts of money into their economy to stimulate growth. Yet the above chart is rather clear in the outcome. Some point to unemployment in Japan remaining low. This is more a sleight of hand with economic data. Although the official rate is low, nearly 1 out of 3 Japanese workers are considered part-time employed. That is, no security of long-term employment. We have seen a massive rise in the number of Americans that now work in a part-time fashion. No benefits, lower wages, and job security that is no longer an option in the longer term. It is easy to see why asset prices in Japan have remained depressed for so long. Prices in the U.S. are showing no sign of inflationary pressures because there is little mechanism to force wages up with such a giant over supply of labor in the market. This is possibly one of the major points missed by those who predict inflation or hyper-inflation in the future. Central banks can print but they can’t force wages up especially in a global market where cheap wages are the status quo. To the contrary, banks are following the zombie like behavior of Japan banks by hoarding funds:

Now that we’ve had three full years after the bubble popped, we can see what banks have done to “fix” the problem:
-Hoard money to fix balance sheet imbalances
-Suspend mark to market (Japan banks zombie like tool of preference)
-Ignore major commercial real estate problems
-Drag out the real estate problems (we have done the same with banks delaying the foreclosure process, stopped lending their own capital in place of government loans, and banks have turned inward with government bailout funds).
The above chart shows that banks are still sitting on an enormous amount of excess reserves. Now that due diligence is back (to a certain degree) who are banks going to lend to? 4 out of 10 workers in the U.S. are employed by the low paying service sector. Close to 15 million are officially unemployed and unless we go back to the easy lending mortgage days, they won’t be getting any bank money soon. We have another 9 million workers that are employed part-time for economic reasons (similar to the large employment base of Japan). You think this group is going to get a loan for a home anytime soon? Banks have turned their profits inward while the real economy is largely in stagnation. Yet if Japan is any indicator, these profits will start to go down:

While it is easy to make money right now since a large part of the competition has failed while a select few have been given government backing and funding, as time goes on this profitability goes away. And the real economy in Japan has languished all this time. The BIS paper in 2003 gives a wonderful synopsis of what led to the Japanese boom and bust economy:
“The intensified bullish expectations were certainly grounded in several interconnected factors. The factors below are often pointed out as being behind the emergence and expansion of the bubble:
• aggressive behaviour of financial institutions
• progress of financial deregulation
• inadequate risk management on the part of financial institutions
• introduction of the Capital Accord
• protracted monetary easing
• taxation and regulations biased towards accelerating the rise in land prices
• overconfidence and euphoria
• overconcentration of economic functions in Tokyo, and Tokyo becoming an international financial centre
Focusing on monetary factors, it is important to note the widespread market expectations that the then low interest rates would continue for an extended period, in spite of clear signs of economic expansion. The movement of implied forward rates from 1987 to 1989 (Figure 5) shows that the yield curve flattened while the official discount rate was maintained at a low level.”
You might as well put this label on the U.S. Aggressive behavior of financial institutions? Doesn’t get more aggressive than giving a loan to someone with no job and no income. Progress of financial deregulation? What about repealing Glass-Steagall in 1999, protection we had put in place back from the Great Depression. Inadequate risk management? We need only look at AIG, Lehman Brothers, Bear Stearns, Fannie Mae and Freddie Mac, and many others. Protracted monetary easing? Does a zero percent interest rate and buying up of mortgage backed securities count? Taxation and regulations biased toward rising prices? How about giving new home buyers a tax credit when they were going to buy anyway? Over confidence and euphoria? Just go to YouTube and watch some of the real estate commercials from the peak days of the housing bubble.
We have a lot that is similar to Japan and their boom and bust economy. If their path is any indication of our own, we have a long road ahead and getting home prices back up is probably going to be the least of our concerns.
No comments:
Post a Comment